
Break-Even ROAS for a Service Business, Market by Market
Break-even ROAS is 1 divided by your gross margin per job. The math for booked jobs, a management fee and each market you run, written out.

The short answer
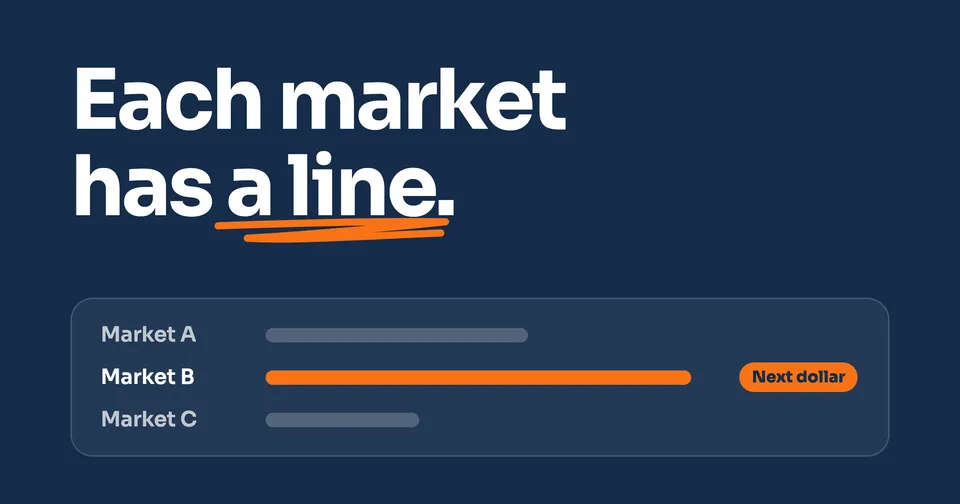
Break-even ROAS (return on ad spend, the revenue each ad dollar brings back) is 1 divided by your gross margin per job. At a 40% margin, every ad dollar has to bring back $2.50 in booked jobs. A management fee raises that line. Each market you run has its own line, so check each one, not only the number for the whole account.
The rest of this guide shows you how.
On this page
Break-even ROAS is 1 divided by your gross margin per job. ROAS, return on ad spend, is the revenue each ad dollar brings back. If 40% of every job's invoice is left after materials and labor, each ad dollar has to bring back $2.50 in booked jobs before the ads stop costing you money. Add a management fee and the line moves up: at that 40% margin, with $2,000 of ad spend and a $1,249 fee, it's about 4.06.
Most break-even ROAS guides are written for online stores: an order, a product cost, a shipping charge. They skip a step a service business can't. Your ad buys a lead, and only some leads become booked jobs. And across several markets, one number for the whole account can sit above the line while a market sits below it.
The margins, lead costs and markets below are examples. None of them is a client's result.
What ROAS means when you sell jobs, not orders
ROAS is the revenue from booked jobs divided by the ad spend that brought them in. Google writes it as a percentage in its own example: "$5 USD in sales ÷ $1 USD in ad spend x 100% = 500% target ROAS." This post writes it as a plain number: 5, not 500%.
A service business can't count it from orders, because the ad doesn't sell anything. It buys a call or a form. So for a job, ROAS comes from three numbers:
- Cost per lead: the ad spend divided by the calls and forms it brought in.
- Close rate: the share of those leads that became booked jobs.
- Average job: the average invoice of those booked jobs.
ROAS = close rate × average job ÷ cost per lead.
Take a $150 lead, 3 in 10 leads booked and a $1,200 average job. Each lead is worth 0.30 × $1,200, or $360, in booked work, and $360 ÷ $150 is a ROAS of 2.4. For what a lead costs in your trade, see Google Ads for contractors.
The ROAS in your ads account only knows what you told it
Google Ads sees the call or the form, not the invoice. To bid toward a ROAS target, Google says "you'll need to set values for the conversions you're tracking," and those values are whatever you give it. Until booked jobs and their invoice amounts go back in, through what Google calls offline conversion imports, the ROAS it reports is an estimate.
The break-even ROAS formula
Break-even ROAS = 1 ÷ gross margin per job.
Gross margin per job is the share of a job's invoice left after the costs of doing that job: materials, the crew's hours, any subcontractor, the fuel and equipment to get it done. Rent, office staff and software are overhead, and stay out of this number.
At break-even, the gross profit the ads bring back equals what the ads cost, and nothing more.
Check it with a month at a 40% margin, where the line is 1 ÷ 0.40, or 2.5. Spend $1,000 on ads and book $2,500 of jobs from them. Forty percent of $2,500 is $1,000, exactly what the ads cost. Nothing is left over, which is what break-even means.
| Gross Margin per Job | Break-Even ROAS |
|---|---|
| 30% | 3.33 |
| 35% | 2.86 |
| 40% | 2.50 |
| 50% | 2.00 |
| 60% | 1.67 |
Some guides put break-even at a ROAS of 1, or 100%. That only holds for a business with no job costs: a ROAS of 1 brings back the ad spend, and the materials and labor on those jobs are still unpaid.
The example above lands just under a 40% line: 2.4 against 2.5. To find the close rate that breaks even, multiply the line by your cost per lead and divide by your average job: 2.5 × $150 ÷ $1,200 = 31.25%. Booking 3 in 10 falls just short. Booking 1 in 3 clears it.
Add the management fee
A management fee is a fixed monthly cost, so it belongs in the line too:
Break-even ROAS with a fee = (1 ÷ gross margin) × (1 + fee ÷ ad spend).
One market at our Acquisition minimum, $2,000 of ad spend plus the $1,249 fee, at a 40% margin: 2.5 × (1 + 1,249 ÷ 2,000) = 2.5 × 1.6245, about 4.06.
Two markets at our published Enterprise price, $4,000 of ad spend pooled across them plus the $2,499 fee, land in the same place: 2.5 × 1.62475, also about 4.06. That's $16,247.50 of booked jobs in the month. Check: 40% of $16,247.50 is $6,499, the month's cost.
The fee weighs less as spend grows. Ours stays flat through $5,000 a month of ad spend per market, counted across the whole account on Enterprise, then adds 10% of only the spend above that. So its share of the month, and the line, falls as spend rises.
Market by market: how one blended number hides a weak market
These are example numbers, not a client's: three markets on one account, $9,000 of ad spend between them and $38,400 of booked jobs. The fee is our published three-market price, $3,249, split by each market's share of the spend.
| Market A | Market B | Market C | Whole Account | |
|---|---|---|---|---|
| Ad spend | $3,000 | $4,000 | $2,000 | $9,000 |
| Booked jobs from the ads | $12,000 | $22,000 | $4,400 | $38,400 |
| ROAS | 4.00 | 5.50 | 2.20 | 4.27 |
| Gross margin per job | 35% | 40% | 40% | 38.4% |
| Share of the fee | $1,083 | $1,444 | $722 | $3,249 |
| Break-even ROAS with the fee | 3.89 | 3.40 | 3.40 | 3.54 |
| Gross profit after ads and fee | $117 | $3,356 | -$962 | $2,511 |
The blended ROAS, one figure for the whole account, is 4.27, above every line in the table. On a one-number report the account is fine: it clears $2,511 after the ads and the fee.
Now split it. Market C spent $2,000 and booked $4,400, a ROAS of 2.2. At a 40% margin, its line is 2.5 before the fee and 3.40 with its share. Its $2,000 brought back $1,760 of gross profit, so it lost $240 before the fee and $962 after it. Every month it runs like that, Markets A and B pay for it.
Market A looks healthy at 4.00, but its line is 3.89, so it clears it with only $117 of gross profit to spare. Its margin is 35%, not 40%. Your margin can differ by market if crew wages, material prices or drive times do.
Splitting a shared fee between markets
Splitting by share of ad spend, as the example does, puts 36.1 cents of fee on every ad dollar ($3,249 ÷ $9,000), so each market's line is its margin line times the same 1.361. An even split, $1,083 a market, raises Market C's line from 3.40 to 3.85 and lowers Market B's to 3.18. Either works. Changing the split from month to month doesn't, because then you're comparing markets on different rules.
Our guarantee's bar, and why it sits below your break-even line
Our guarantee is called Pays for itself, or you stop paying. By day 90, a month of booked jobs from our leads should bring in more than that month costs you, ad spend included. For two markets at the Enterprise minimum, that month costs $6,499: the $2,499 fee plus $4,000 of ad spend. Only jobs from leads we track count: a form or call-button tap on your website, a call or message through your Google listing, or a lead from ads we run for you. Word of mouth doesn't count, and leads from Meta ads count only once we can check them against Meta's own data.
We check the third month after the clock starts, not the three months added up. On Enterprise, the clock starts the day your first market's ads go live, and the check covers the whole account. We never assume a close rate. To use it:
- Tell us in writing that you want to use it.
- Show us the booked jobs from our tracked leads in that month, with invoices or a job list. Until you send them, the clock pauses.
- If they brought in less than the month cost you, our fee stops and we keep working until a month pays for itself, then billing starts again. The ad spend still goes to the ad platform.
Your part: send what we ask for and the access we need, keep your business details accurate, answer the real leads, have room for the work and help us check the outcome. A month with ad spend below the minimum ($2,000, pooled per market on Enterprise) doesn't count.
That bar is revenue. If every one of those jobs came from the ads, $6,499 of booked jobs on $4,000 of ad spend would be a ROAS of about 1.62. At a 40% margin, the same month only breaks even at about 4.06. The gap between the two is your job costs.
Because it's measured across the whole account, the guarantee wouldn't catch a Market C. The example account books $38,400 from the ads alone against a $12,249 month and clears it easily. Catching Market C is what each market's line is for.
What to do with a market under its line
Check it in this order before you move money.
- A whole month, not a few days. A few days read as a whole month will throw the comparison off. Compare full months, the way the guarantee does.
- The close rate in that market. If calls go unanswered or quotes go out late, ROAS drops without the ads changing. Seeing that takes every booked job tied to the lead that brought it in, starting with how to track phone calls from your website.
- The jobs themselves. Smaller jobs pull that market's ROAS down. Higher labor or material costs push its line up. Sometimes the line moved, not the ROAS.
- Then the money. On Enterprise, ad spend is pooled across the account, so moving budget from Market C to Market B is a setting, not a new contract. But Market B's 5.50 is an average. A local market only has so many searches, so the next dollar there can bring back less. Move money in steps and check the line after each.
Small numbers swing. If Market C's jobs average $1,200, one job more or less moves its ROAS by 0.6, to 2.8 or 1.6, and two more would put it right at its line. Read a few months before you cut a market.
The search side of the same comparison is in local SEO for multiple locations.
Where break-even ROAS stops
It covers the ads and the job costs, not the rest of the business. Triple Whale's guide says break-even ROAS "doesn't capture all of your costs, such as salaries, legal fees, banking fees, taxes, interest, and more." For a service business, add the office, the shop and the trucks.
It also counts the first job only, though a customer who books again or signs up for a maintenance plan is worth more. Leaving that out keeps the line checkable against real invoices.
The number to bring to your next review
Bring one number per market: its line. It's 1 divided by that market's margin, raised by its share of the fee, and you check it against the ROAS from jobs that market actually booked. The whole-account number tells you whether the account is fine. The lines tell you which markets are earning their spend.
If you'd rather we work those out and run your markets as one account, that's what Enterprise is for, with a guarantee measured across the whole account.
People also ask
What is a good ROAS?
One above your own break-even line, and that line depends on your margin, so no single number fits every business. WhatConverts says a good ROAS "typically ranges from 2:1 to 4:1 (200%-400%)," then adds that "there is no universal 'good' ROAS." At a 40% margin, your line is 2.5 before any fee, so a ROAS of 3 clears it. Add a $1,249 fee on $2,000 of spend and the line is about 4.06, so the same 3 falls short.
How do you calculate break-even ROAS?
Divide 1 by your gross margin per job, the share of a job's invoice left after materials, labor and the other costs of doing it. At 40%, that's 1 ÷ 0.40 = 2.5. If someone manages your ads for a monthly fee, multiply by 1 plus the fee divided by your ad spend. With $2,000 of spend and a $1,249 fee, that's 2.5 × 1.6245, about 4.06.
Is break-even ROAS different from break-even ROI?
Yes. ROAS is revenue divided by ad spend, so it only says how much money came back. ROI takes the costs out first: return minus cost, divided by cost. Break-even ROI is always 0%. Break-even ROAS is a number above 1, and your margin decides how far above.
How do I raise ROAS without changing the ads?
For a service business, three numbers set ROAS: cost per lead, close rate and average job. ROAS is close rate times average job, divided by cost per lead, so a $150 lead, 3 in 10 booked and a $1,200 average job is a ROAS of 2.4. Two of the three sit outside the ads account. Book 4 in 10 leads instead of 3 in 10, and the same ads show a ROAS of 3.2. Raise the average job to $1,500, and it's 3.0.
Sources
- Google Ads Help, About Target ROAS bidding, read 30 September 2026.
- Google Ads Help, About offline conversion imports, read 30 September 2026.
- Triple Whale, Breakeven ROAS: Definition, Formula & Why It's Essential (updated 22 December 2025), read 30 September 2026.
- Disruptive Advertising, How to Calculate Break Even ROAS The Right Way, read 30 September 2026.
- WhatConverts, What Is a Good ROAS in 2025?, read 30 September 2026.
Keep Reading
 Stage 3: Enterprise Local SEO for Multiple Locations: What to Do After Setup Comparing markets side by side, on the search side. 7 min read · Read the Guide →
  Stage 2: Acquisition Google Ads for Contractors: What It Costs, and Is It Worth It? What a lead costs in your trade, for one market. 12 min read · Read the Guide →
  Stage 1: Foundation How to Track Phone Calls From Your Website The tracking that ties a booked job back to its market. 9 min read · Read the Guide →